Reveal › Get Started
Budget ROI Report
Introduction
The Budget ROI Report works by comparing student activity data on edtech sites with the license terms of your edtech partners. The report shows the end user their negotiated rate and also their real price per student (or device) based on student activity.
For more information about student activity data on edtech sites, click the Usage Explorer tab.
To specify or review the license terms of your edtech partners, click the Subscription Management tab.
Filters
There are currently two types of dropdown filters on the Budget ROI Report
-
Report: The default report is Last Week. This can be changed to previous weeks or months.
-
Usage: The default usage description is Usage. Optionally, users can view Waste as the inverse or use Hide to remove usage data.
Overview
The Overview is a high level summary of your edtech application investments
-
License and Non-Recurring Cost: The aggregate of all investments that have been added to Reveal.
-
Total Students: Number of Active Student during the Report period
-
Cost per Student: The total costs divided by total students.

Investment Breakdown
The Investment Breakdown is how to see report data separated by school and application. The table offers column level sorting per column and each header can be clicked to toggle ascending and descending.
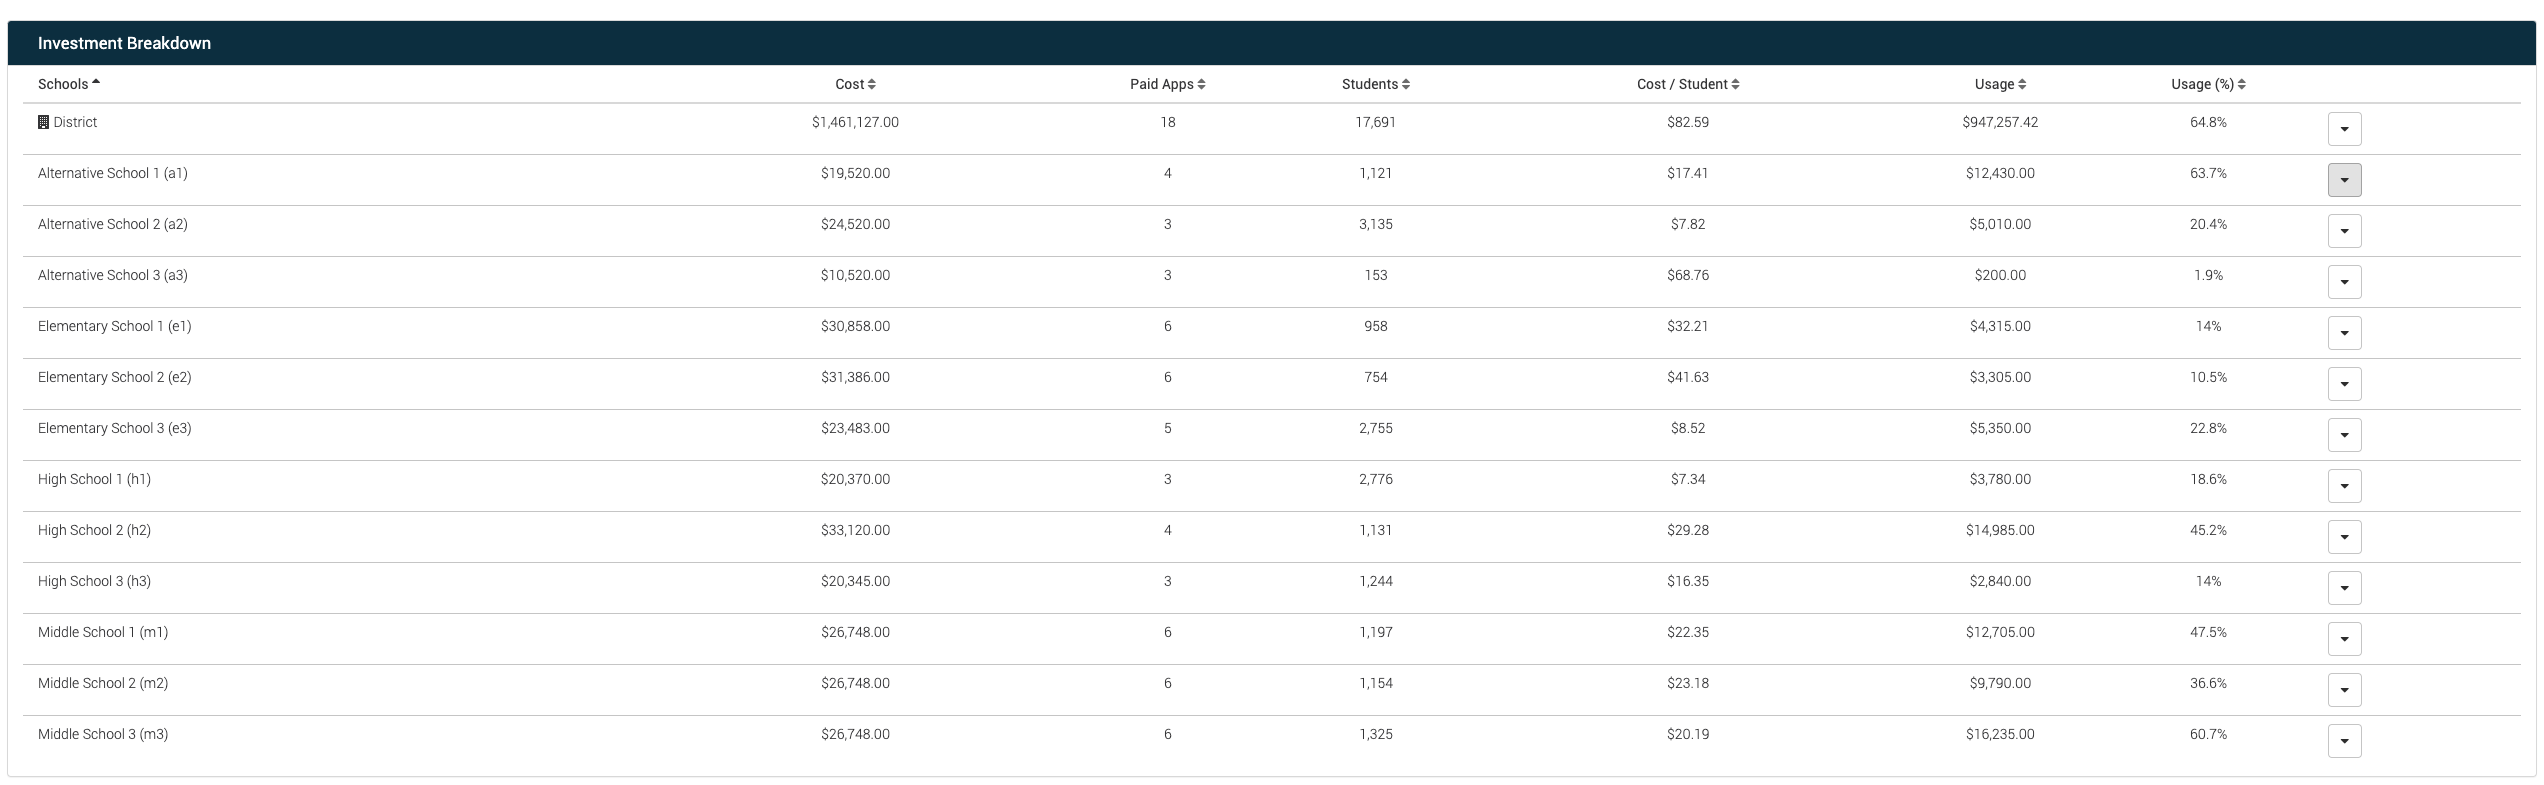
Column Details
|
Column |
Definition |
|---|---|
|
School Name |
Where students are rostered and applications assigned. |
|
Cost |
Sum of total assigned subscriptions dollars assigned to school |
|
Paid Apps |
Total number of configured subscriptions |
|
Students |
Total number of rostered students |
|
Cost / Student |
Cost divided by total number of students |
|
Usage |
Sum of all school usage |
|
Usage % |
Usage divided by Cost |
Expanded Column Details
To drill down into subscription details per school click the dropdown icon on the right side of the screen.
|
Column |
Definition |
|---|---|
|
Subscriptions |
Application Name |
|
Cost |
License Count x Cost per License |
|
Students |
Student Count with application activity |
|
Cost / Student |
Cost divided by total number of students with application activity |
|
Usage |
Student x Cost per License |
|
Usage (percent) |
Usage / Cost |
Use the Print button to print out the Reveal report or to save it as a PDF.